Troubleshooting Switch Performance Issues: Tools of the Trade

Deniz Kaya - CCSI, CCNP, CCSP, CPTS, MCT
Here are some commands which help us to locate performance issue problems in a switching environment. Commands of course are not limited to ones mentioned below, but I believe these are the most used ones.
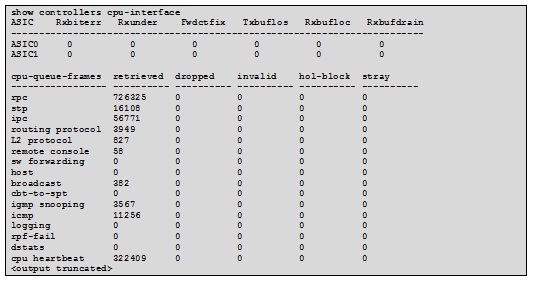
Show controllers cpu-interface
If the switch is being flooded by a specific packet type, the hardware places that packet type into the appropriate CPU queue and counts it. Enter the show controllers cpu-interface privileged EXEC command to see the packet count per queue.

The switch also counts the CPU-bound packets that are discarded due to congestion. Each CPU receive queue has a packet-count maximum. When the receive queue maximum is reached, the switch hardware discards packets destined for the congested queue. The switch counts discarded packets for each queue. Increased discard counts for a particular CPU queue mean heavy usage for that queue.
Enter the show platform port-asic stats drop privileged EXEC command to see the CPU receive-queue discard counts and to identify the queue discarding packets. This command is not as useful as the show controllers cpu-interface command because the output shows numbers for the receive queues instead of names, and it shows only the discards. Because the switch hardware sees the CPU receive-queue dropped packets as sent to the supervisor, the dropped packets are called Supervisor TxQueue Drop Statistics in the command output.
Show processes cpu
The CPU becomes too busy when the CPU receives too many packets from the switch hardware or when a system process consumes too much CPU time. When either of these functions uses CPU resources to the detriment of the other, the CPU is too busy. For example, if the CPU is receiving many packets because of a broadcast storm on the network, it is so busy processing all the those packets that the other system processes do not have access to CPU resources.
To determine switch CPU utilization, enter the show processes cpu sorted privileged EXEC command. The output shows how busy the CPU has been in the past 5 seconds, the past 1 minute, and the past 5 minutes. The output also shows the utilization percentage that each system process has used in these periods.

In this output, the CPU utilization for the last 5 seconds shows two numbers (5%/0%).
• The first number, 5%, tells how busy the CPU was in the past 5 seconds. This number is the total CPU utilization for all the active system processes, including the percentage of time at the interrupt level.
• The second number, 0%, shows the percentage of time at the interrupt level in the past 5 seconds. The interrupt percentage is the CPU time spent receiving packets from the switch hardware. The percentage of time at interrupt level is always less than or equal to the total CPU utilization.
Two other important numbers are shown on the same output line: the average utilization for the last 1 minute (6 percent in this example) and the average utilization for past 5 minutes (5 percent in this example). These values are typical for a nonstacked switch in a small and stable environment.
There can be hundreds of active system processes on the CPU at any time. This number can vary, based on the switch model, the Cisco IOS release, the feature set, and (if applicable) the number of switches in a switch stack. For example, on a stack of Catalyst 3750 switches running the IP base image, there are typically 475 active system processes. The Catalyst 2960 switch running the LAN base image has a smaller number of active processes than a stack of Catalyst 3750 switches. In general, the more features in the Cisco IOS image, the more system processes.
Show controller ethernet-controller
For Catalyst 3750, 3550, 2970, 2950/2955, 2940, and 2900/3500XL switches use the command show controller ethernet-controller to display traffic counter and error counter output that is similar to the sh port, sh interface, sh mac and show counters output for Catalyst 6000, 5000 and 4000 series switches.

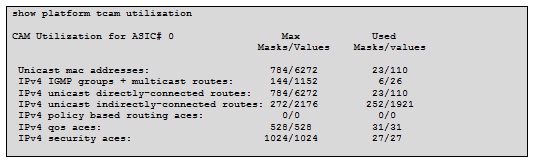
Show platform tcam (utilization)
Use the show platform tcam privileged EXEC command to display platform-dependent ternary content addressable memory (TCAM) driver information.
Ternary Content Addressable Memory (TCAM):
TCAM works with CEF to make extremely fast forwarding decisions. TCAM entries are composed of Value, Mask and Result combinations.
• Values — Always 134 bits consisting of source and destination addresses along with relevant protocol infromation.
• Masks — Also 134 bits set to match value bits, or not match value bits that do not matter. This is so that a switch can do a bitwise and with access lists or access control entities (ACE).
• Results — Numerical values that represent what action to take after the TCAM lookup.
• When the TCAM cannot process the packet it is punted to the CPU for processing. Here are some reasons why a packet is punted:
• Protocols that send multicast or broadcast packets.
• Administrative access to a switch such as telnet or ssh.
• Packets that use features not supported in hardware.
• A switch’s TCAM has reached capacity. TCAM might reach capacity with large routing tables or a large number of ACLs.

Note: Allocation of TCAM entries per feature uses a complex algorithm. The above information is meant to provide an abstract view of the current TCAM utilization
Show platform ip unicast (counts)
Use the show platform ip unicast privileged EXEC command to display platform-dependent IP unicast routing information.
")
Show interfaces counters
Use the show interfaces counters privileged EXEC command to display various counters for the switch or for a specific interface.

Debug spanning-tree
Use the debug spanning-tree privileged EXEC command to enable debugging of spanning-tree activities. Use the no form of this command to disable debugging.
Debug standby
The debug standby terse command is probably the most useful option because it gives a short form output of all HSRP errors, events, and packets:

From here, if you see a Coup problem, for example, you might want to turn off the terse option and replace it with a full packet-level debug. Conversely, if you see that there is an issue with interface tracking, you might want to replace the terse option with the event option to get greater detail.
Debug ethernet-controller
You can use this command to find out the cause of address flapping problems:
On Cisco switches, MAC addresses are learned once per a port; however, if the same MAC address is seen on two different ports, it will cause an ADDR_FLAP error to be printed to the log. This normally happens one of two ways. If there is a port anywhere in the switched intranet that’s looped back to itself, addresses will jump between the real port and the port that’s in the path to the looped port. Or, if there is a problem with a redundant PF CARP firewall which causes both routers to be in MASTER mode for a given CARP port.
When this happens, the error reads:
ADDR_FLAP, RTD, LOG_ALERT, 0, „%s relearning %d addrs per min
Which is nice to know, but while Cisco Switches may tell you that there’s someone causing problems, it won’t tell you who it is unless you turn on debugging output.
In order to get the MAC address of the host causing the problems, do a:
debug ethernet-controller addr
Show ip traffic
To display statistics about IP traffic, use the show ip traffic EXEC command.

_____________________________________________________
Deniz Kaya is a senior security instructor at New Horizons Bulgaria
Deniz has planned, directed, and coordinated multiple projects simultaneously, ensuring goals and objectives were accomplished within time limitations and funding conditions. His core competency lies in areas of penetration testing, security assessments, enterprise network design, capacity planning and vendor evaluation. Equipped with Industry recognized certification under his belt, Deniz has demonstrated his determination to continuously self-improve and make his presence felt.
Deniz currently holds the prestigious industry certifications Microsoft Certified Systems Engineer (MCSE), Certified Cisco Systems Instructor (CCSI #31650), CCIE Security Written, Cisco Certified Network Professional (CCNP), Cisco Certified Security Professional (CCSP), Cisco Ironport Certified Security Instructor (ICSI), Cisco Ironport Certified Security Professional (ICSP), Certified Penetration Testing Specialist (CPTS), Microsoft Certified Trainer (MCT).
♦ Contact us for further information on Cisco courses.